
Bob Anderson Chartbook for SierraChart
This chartbook recreates Bob's NinjaTrader chart for his goldline/redline strategy, ideally used on a 1-minute chart.
https://www.youtube.com/playlist?list=PLir78uvI10JyqmrxEYhnJjXIuu7bVnTFf
Indicators used:
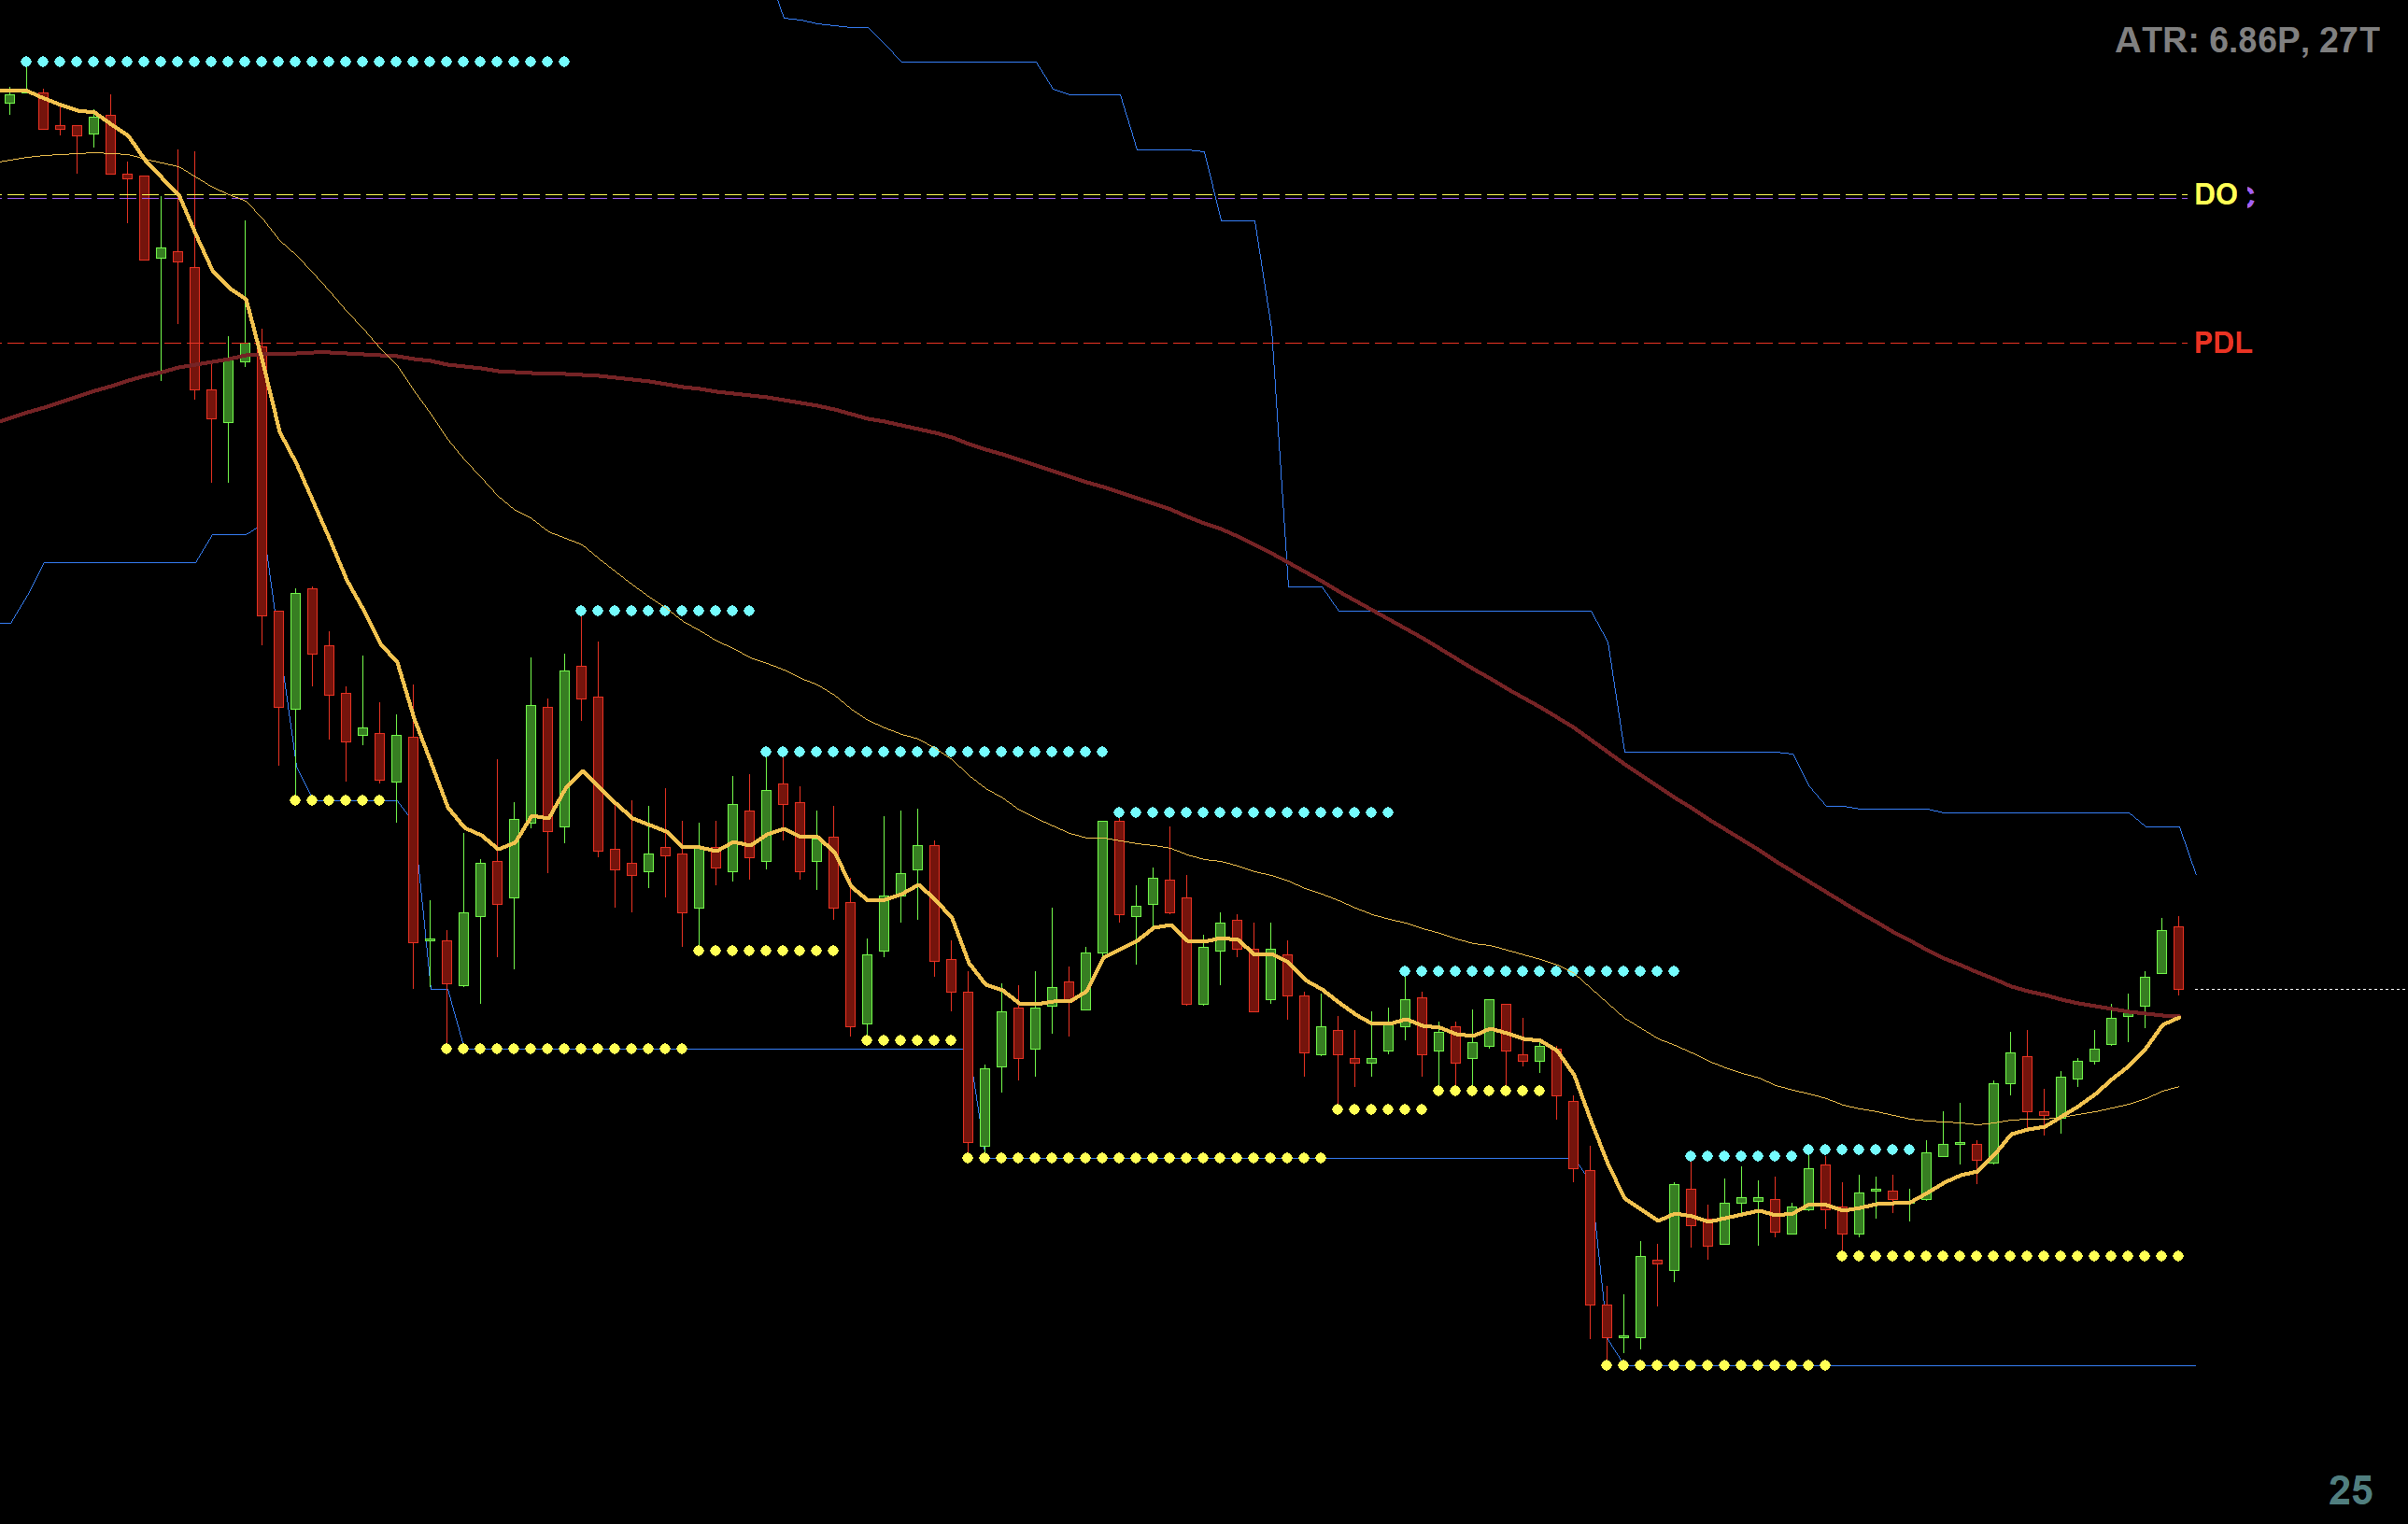
- 9 EMA (thick gold)
- 45 EMA (thin gold, equivalent to 9 EMA on 5-minute chart)
- 105 SMA (thick red, equivalent to 21 SMA on 5-minute chart)
- Static levels for PDO, PDH, PDL, PDC, DO
- Donchian channel (period 60)
- Swing levels (swing length 5)
- Countdown timer
- ATR display
The chartbook file described on this page can be found on GitHub
If you find any indicators missing, please make sure you have copied the latest LunarTick_64.dll into your SierraChart Data folder.
Please note: After loading any downloaded chartbook for the first time, you should select Edit > Translate Symbols To Current Service.
You may also like:

Initial Balance for SierraChart
Shows the Initial Balance region and levels. Features:...

TO Method Chartbook for SierraChart
The man, the myth, the legend! This chartbook...

Swing Levels for SierraChart
Shows high and low swings, with a configurable...

ADX Display for SierraChart
Displays the ADX value in a text label...